2431036af25a8db40410da64bdd6d3c29bfe24f1,ggplot/ggplot.py,ggplot,draw_plot,#ggplot#,165
Before Change
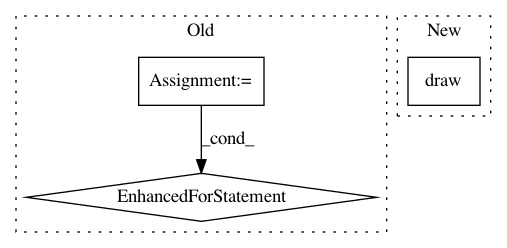
        panel = plot.panel

        // Draw the geoms
        for l, ldata in zip(plot.layers, data):
            l.draw(ldata, panel, plot.coordinates)

        // Decorate the axes
        //   - xaxis & yaxis breaks, labels, limits, ...
        //   - facet labels
        //
        // ploc is the panel location (left to right, top to bottom)
        for ploc, finfo in panel.layout.iterrows():
            panel_scales = panel.ranges[ploc]
            ax = panel.axs[ploc]
            set_breaks_and_labels(plot, panel_scales, finfo, ax)
After Change
        // Draw the geoms
        for layer in self.layers:
            layer.draw(self.panel, self.coordinates)

        // Decorate the axes
        //   - xaxis & yaxis breaks, labels, limits, ...
        //   - facet labels
In pattern: SUPERPATTERN
Frequency: 3
Non-data size: 3
Instances
Project Name: has2k1/plotnine
Commit Name: 2431036af25a8db40410da64bdd6d3c29bfe24f1
Time: 2016-05-02
Author: has2k1@gmail.com
File Name: ggplot/ggplot.py
Class Name: ggplot
Method Name: draw_plot
Project Name: matplotlib/matplotlib
Commit Name: ff90100b13be1ebdfe53f1bf02309c78e65278fe
Time: 2018-02-06
Author: jklymak@gmail.com
File Name: lib/matplotlib/tests/test_constrainedlayout.py
Class Name:
Method Name: test_constrained_layout7
Project Name: matplotlib/matplotlib
Commit Name: e30d055aca6da86ef147f6772b7b53a82b645b9e
Time: 2018-10-05
Author: 23121882+ImportanceOfBeingErnest@users.noreply.github.com
File Name: tutorials/intermediate/constrainedlayout_guide.py
Class Name:
Method Name: