99fe730f9963f87aaf5d614bb74d60fc3d8e8173,examples/connectivity/plot_probabilistic_atlas_extraction.py,,,#,24
Before Change
from matplotlib import pyplot as plt
plt.figure(figsize=(10, 10))
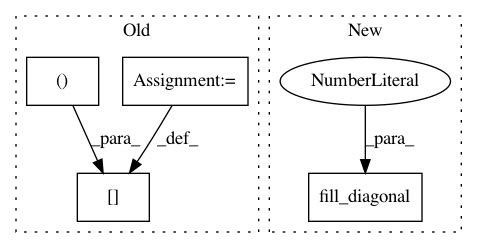
// Mask out the major diagonal
correlation_matrix[range(correlation_matrix.shape[-1]),
range(correlation_matrix.shape[-1])] = 0
plt.imshow(correlation_matrix, interpolation="nearest", cmap="RdBu_r",
vmax=0.8, vmin=-0.8)
plt.colorbar()
// And display the labelsAfter Change
from matplotlib import pyplot as plt
plt.figure(figsize=(10, 10))
// Mask out the major diagonal
np.fill_diagonal(correlation_matrix, 0)
plt.imshow(correlation_matrix, interpolation="nearest", cmap="RdBu_r",
           vmax=0.8, vmin=-0.8)
plt.colorbar()
// And display the labels
In pattern: SUPERPATTERN
Frequency: 5
Non-data size: 4
Instances Project Name: nilearn/nilearn
Commit Name: 99fe730f9963f87aaf5d614bb74d60fc3d8e8173
Time: 2015-11-08
Author: arokem@gmail.com
File Name: examples/connectivity/plot_probabilistic_atlas_extraction.py
Class Name:
Method Name:
Project Name: nilearn/nilearn
Commit Name: 99fe730f9963f87aaf5d614bb74d60fc3d8e8173
Time: 2015-11-08
Author: arokem@gmail.com
File Name: examples/connectivity/plot_signal_extraction.py
Class Name:
Method Name:
Project Name: SINGROUP/dscribe
Commit Name: 114c77e248d76291559b647d08e5dde10bcdbdde
Time: 2017-08-06
Author: lauri.himanen@aalto.fi
File Name: describe/descriptors/coulombmatrix.py
Class Name: CoulombMatrix
Method Name: coulomb_matrix
Project Name: nilearn/nilearn
Commit Name: d5af4c37893a7ead45a966eb89a3e4018a97e556
Time: 2015-10-06
Author: sb238920@is223297.intra.cea.fr
File Name: nilearn/connectivity/connectivity_matrices.py
Class Name:
Method Name: sym_to_vec
Project Name: SINGROUP/dscribe
Commit Name: 114c77e248d76291559b647d08e5dde10bcdbdde
Time: 2017-08-06
Author: lauri.himanen@aalto.fi
File Name: describe/descriptors/sinematrix.py
Class Name: SineMatrix
Method Name: sine_matrix