0706ad95fa091003f29bd1d568a17324453bb297,examples/inverse/plot_lcmv_beamformer_volume.py,,,#,24
Before Change
plt.plot(stc.times, stc.data[np.argsort(np.max(stc.data[:, idx],
axis=1))[-40:]].T)
plt.xlabel("Time (ms)")
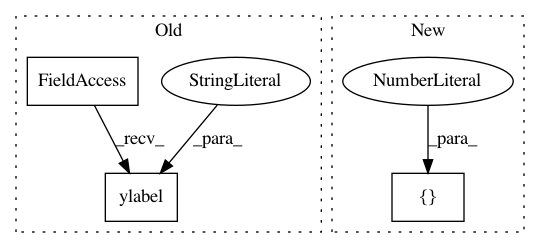
plt.ylabel("LCMV value")
plt.show()
After Change
// We can also visualize the activity on a "glass brain" (shown here with
// absolute values):
clim = dict(kind="value", lims=[0.3, 0.6, 0.9] )
abs(stc).plot(src=forward["src"], subject="sample", subjects_dir=subjects_dir,
mode="glass_brain", clim=clim)
In pattern: SUPERPATTERN
Frequency: 3
Non-data size: 3
Instances Project Name: mne-tools/mne-python
Commit Name: 0706ad95fa091003f29bd1d568a17324453bb297
Time: 2018-09-15
Author: jasmainak@users.noreply.github.com
File Name: examples/inverse/plot_lcmv_beamformer_volume.py
Class Name:
Method Name:
Project Name: mne-tools/mne-python
Commit Name: 64be522285d5eeea4e3fb4c6df133984fc65b74e
Time: 2018-09-08
Author: larson.eric.d@gmail.com
File Name: examples/time_frequency/plot_compute_source_psd_epochs.py
Class Name:
Method Name:
Project Name: SINGROUP/dscribe
Commit Name: fc95dc7c8e0f51bdfdd940119319243dd939cfe0
Time: 2018-07-09
Author: yashasvi.ranawat@gmail.com
File Name: examples/lmbtr.py
Class Name:
Method Name: