ax.set_autoscale_on(False)
// Get plot limits
xlim = ax.get_xlim()
ylim = ax.get_ylim()
// Determine line function
line_func = lambda x: x*slope + intercept
// Get "x" points within limit and map to "y" coordinates
x_points = np.linspace(min(xlim),max(xlim),100)
y_points = np.array(map(line_func,x_points))
// detemine which points are still within the limit of the plot
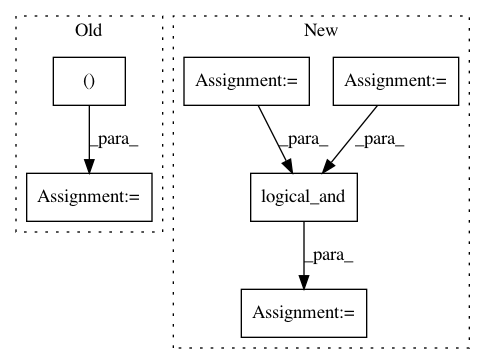
in_range = np.logical_and(y_points > min(ylim),
y_points < max(ylim))
// If some points are withinn the plot draw them on
if np.sum(in_range) > 0:
x_points = x_points[in_range]
y_points = y_points[in_range]