24d6f5e42d775949e191122091826eefa7bf1246,docs/examples/plot_viterbi.py,,,#,27

Before Change


// We can plot the probability curve over time:

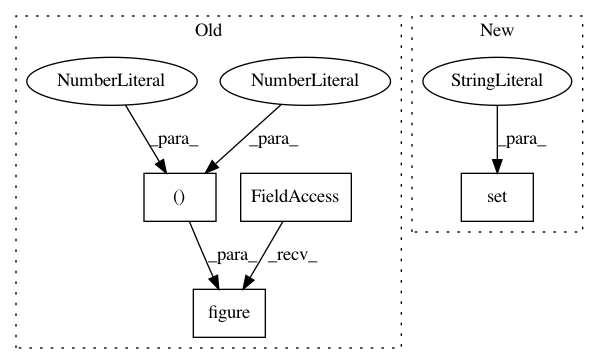
plt.figure(figsize=(12, 4))
plt.plot(times, p, label="P[V=1|x]")
plt.axhline(0.5, color="r", alpha=0.5, label="Descision threshold")
plt.xlabel("Time")
plt.axis("tight")

After Change


fig, ax = plt.subplots()
ax.plot(times, rms)
ax.axhline(0.02, color="r", alpha=0.5)
ax.set(xlabel="Time", ylabel="RMS");

////////////////////////////////////////////////////////////////////////////////////////////////////////////////////////////////////////////////////////////
// The red line at 0.02 indicates a reasonable threshold for silence detection.
Italian Trulli
In pattern: SUPERPATTERN

Frequency: 3

Non-data size: 4

Instances


Project Name: librosa/librosa
Commit Name: 24d6f5e42d775949e191122091826eefa7bf1246
Time: 2020-06-27
Author: bmcfee@users.noreply.github.com
File Name: docs/examples/plot_viterbi.py
Class Name:
Method Name:


Project Name: librosa/librosa
Commit Name: 24d6f5e42d775949e191122091826eefa7bf1246
Time: 2020-06-27
Author: bmcfee@users.noreply.github.com
File Name: docs/examples/plot_presets.py
Class Name:
Method Name:


Project Name: librosa/librosa
Commit Name: 24d6f5e42d775949e191122091826eefa7bf1246
Time: 2020-06-27
Author: bmcfee@users.noreply.github.com
File Name: docs/examples/plot_vocal_separation.py
Class Name:
Method Name: