b2a2dccef7052753b8e2c1d99cf0183a03494c17,examples/pylab_examples/simple_plot.py,,,#,10
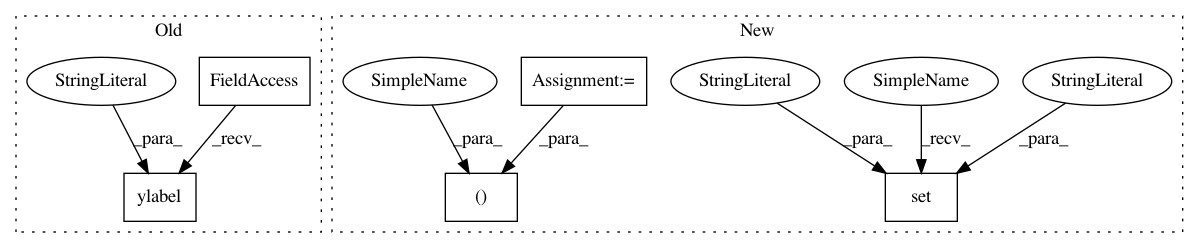
Before Change
plt.plot(t, s)

plt.xlabel("time (s)")
plt.ylabel("voltage (mV)")
plt.title("About as simple as it gets, folks")
plt.grid(True)
plt.savefig("test.png")
plt.show()
After Change
// Note that using plt.subplots below is equivilent to using
// fig = plt.figure and then ax = fig.add_subplot(111)
fig, ax = plt.subplots()
ax.plot(t, s)

ax.set(xlabel="time (s)", ylabel="voltage (mV)",
       title="About as simple as it gets, folks")
ax.grid()

fig.savefig("test.png")
plt.show()
In pattern: SUPERPATTERN
Frequency: 3
Non-data size: 5
Instances
Project Name: matplotlib/matplotlib
Commit Name: b2a2dccef7052753b8e2c1d99cf0183a03494c17
Time: 2017-07-16
Author: dmgt@users.noreply.github.com
File Name: examples/pylab_examples/simple_plot.py
Class Name:
Method Name:
Project Name: matplotlib/matplotlib
Commit Name: 39ca4abed87007e1ce7e2ecae9bfb31c8f4ba57b
Time: 2017-07-16
Author: dmgt@users.noreply.github.com
File Name: examples/subplots_axes_and_figures/subplot_demo.py
Class Name:
Method Name:
Project Name: matplotlib/matplotlib
Commit Name: b2a2dccef7052753b8e2c1d99cf0183a03494c17
Time: 2017-07-16
Author: dmgt@users.noreply.github.com
File Name: examples/pylab_examples/simple_plot.py
Class Name:
Method Name:
Project Name: librosa/librosa
Commit Name: 24d6f5e42d775949e191122091826eefa7bf1246
Time: 2020-06-27
Author: bmcfee@users.noreply.github.com
File Name: docs/examples/plot_viterbi.py
Class Name:
Method Name: